
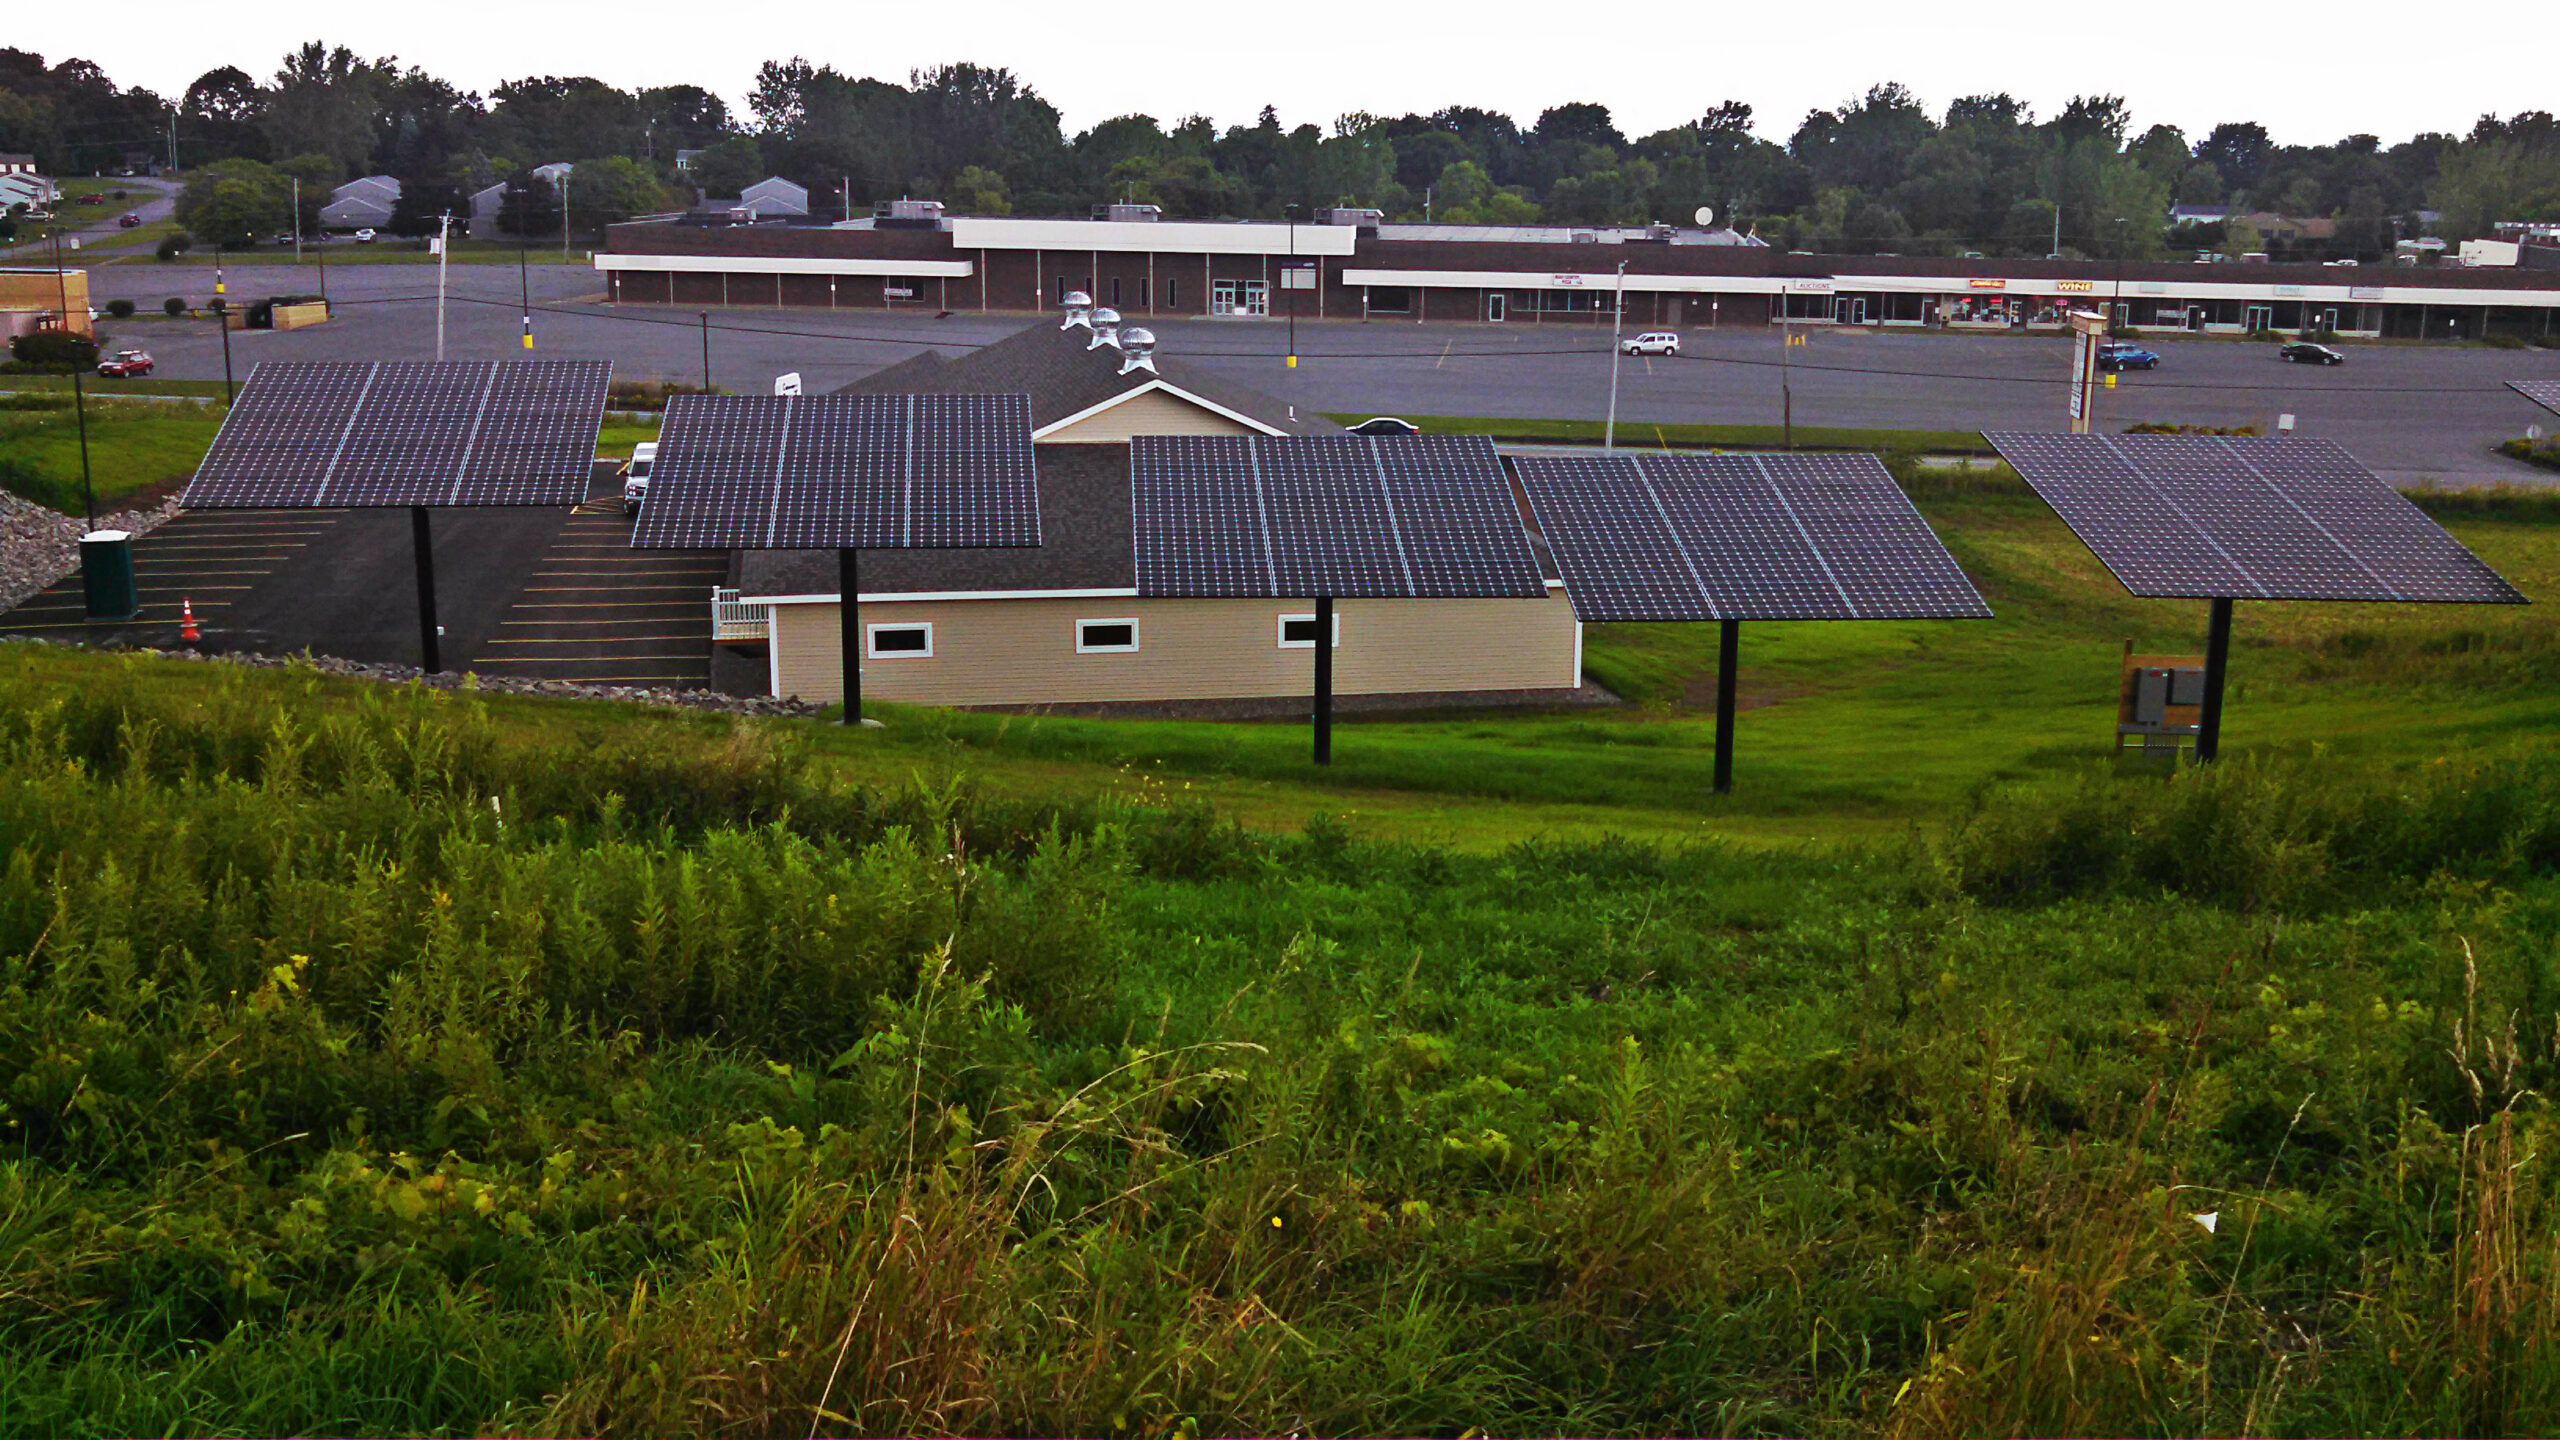
Chittenango Physical Therapy
Mr. Kinglsey also did not want to contribute to foreign wealth in the form of fossil fuels, so to avoid burning any, he elected not to connect to the town’s natural gas line.
Mr. Kinglsey also did not want to contribute to foreign wealth in the form of fossil fuels, so to avoid burning any, he elected not to connect to the town’s natural gas line.
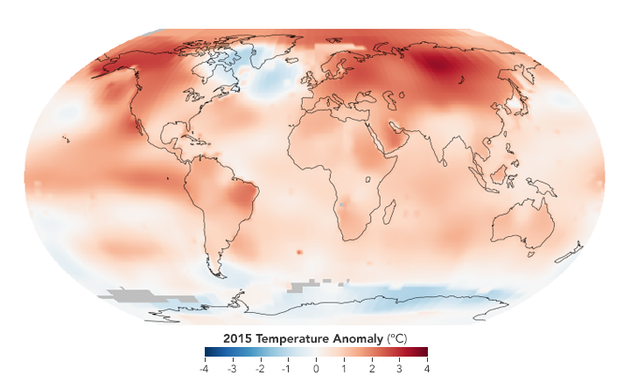
It’s difficult to get people to understand how dramatic climate change is, but sometimes letting images speak for themselves can help. Check out this article from the Huffington Post that includes great images that help explain what everyone is talking about. “2015 was the world’s warmest year, but these charts tell the long story about
As global average temperatures rise due to greenhouse gas emissions, the effects on the planet, such as melting ice caps, extreme weather, drought and rising sea levels, will threaten populations and livelihoods, said the report conducted by humanitarian organisation DARA. It calculated that five million deaths occur each year from air pollution, hunger and disease
“Last year was the hottest on earth since record-keeping began in 1880”-NYT 2014 Breaks Heat Record, Challenging Global Warming Skeptics